Top 8 Datadog Alternatives and Competitors in 2026
Datadog is the gold standard for cloud-native observability. Its 900+ integrations, unified APM + logs + metrics + synthetic monitoring platform, and deep Kubernetes/AWS/GCP visibility make it the default choice for mature DevOps organisations. But it's also notoriously expensive: APM starts at $31/host/month, and costs compound with custom metrics, log retention, and browser check volume. A well-instrumented 50-host environment can easily run $5,000–$15,000/month.
This guide covers 8 Datadog alternatives evaluated in April 2026 — from open-source Grafana stacks to purpose-built synthetic monitoring tools — with real pricing and honest capability comparisons.
Why Teams Look for Datadog Alternatives
Datadog's issues are almost entirely about cost and predictability:
- SKU-based pricing complexity. APM, Infrastructure Monitoring, Log Management, RUM, Synthetics, Database Monitoring — each is priced separately. A seemingly modest deployment can generate surprising invoices.
- Cost at scale is explosive. According to CubeAPM's 2026 comparison, a small team (10 engineers, moderate instrumentation) pays ~$8,185/month on Datadog. The same workload on Grafana Cloud costs ~$3,870/month.
- Vendor lock-in on instrumentation. Datadog's agent and tracing libraries use proprietary APIs — migrating away requires re-instrumenting your entire codebase.
- SaaS-only. No self-hosted option. All telemetry data leaves your infrastructure.
The 8 Best Datadog Alternatives in 2026
1. ScanlyApp ⭐ Editor's Pick (Synthetic Monitoring Replacement)
Best for: Teams that use Datadog Synthetics for Playwright-based browser checks and want to move that workload to a purpose-built, dramatically cheaper platform.
Datadog Synthetic Monitoring charges $5 per 10,000 API test runs and $12 per 1,000 browser check runs. For teams running 200 scheduled Playwright checks per day, that's approximately $70–$100/month for synthetic monitoring alone — on top of the existing Datadog APM/infra bill.
ScanlyApp replaces the Datadog Synthetics layer entirely at $29/month, with advanced multi-browser scanning, visual regression (not available in Datadog Synthetics), Lighthouse performance tracking, and a non-developer dashboard that QA managers can use without a Datadog login.
Head-to-head: Datadog Synthetics vs ScanlyApp
| Feature | Datadog Synthetics | ScanlyApp |
|---|---|---|
| Browser engine | Chromium | Multi-browser (Chromium + Firefox + WebKit·Pro) |
| Visual regression | ✗ | ✓ pixel-diff per run |
| Scheduling | Fixed intervals (min 5s) | ✓ cron + on-demand + CI-triggered |
| Non-dev dashboard | Datadog only | ✓ standalone dashboard |
| Self-hosted option | ✗ | ✓ via Docker |
| API testing | ✓ | ✓ |
| APM / traces | Full APM | ✗ (use Datadog or Grafana for APM) |
| Log management | ✓ (priced separately) | ✗ |
| Pricing (browser checks) | $12/1,000 runs | $29/month flat (all checks) |
| Free plan | ✗ (limited trial) | ✓ |
Pricing: Starts at $29/month (Starter). Growth $79/month, Pro $199/month.
Verdict: Use Datadog for what it's uniquely good at (APM, log management, infrastructure correlation). Use ScanlyApp for synthetic browser monitoring — you get more capability (visual regression, multi-browser scanning, Lighthouse performance tracking) at a fraction of the per-run cost.
2. Grafana + Prometheus (Self-hosted)
Best for: Teams with DevOps capacity that want the most capable open-source observability stack with zero vendor lock-in.
The Grafana/Prometheus/Loki stack is the open-source equivalent of Datadog's metrics + logs + dashboards. Grafana Cloud provides a hosted version with a free tier and usage-based pricing beyond that. The telemetry pipeline uses OpenTelemetry natively — instrumentation is portable across vendors.
Pricing: Self-hosted: infrastructure cost only. Grafana Cloud from $228/year (usage-based). G2: 4.5/5.
Key advantage: Full data ownership when self-hosted. OpenTelemetry-native instrumentation means you can switch backends without re-instrumenting. The Grafana ecosystem (Tempo for traces, Loki for logs, Mimir for metrics) covers every observability pillar.
Limitation: Significant operational overhead to self-host. Grafana Cloud's total cost at scale approaches Datadog's when you add trace + log + metrics volume.
3. New Relic
Best for: Developer-led teams that want a Datadog-class platform with slightly more transparent usage-based pricing.
New Relic offers full-stack observability: APM traces, log management, browser monitoring, synthetic checks, infrastructure monitoring, and AI anomaly detection. Its pricing model is usage-based rather than host-based — which can be cheaper for teams with bursty workloads, but according to SigNoz's analysis, New Relic's per-user costs can run $549/user for full-stack access, making it expensive for large teams.
Pricing: Free 100GB tier per month. Core user at $49/month. Full platform user at $549/month.
Where it beats Datadog: The free 100GB tier is genuinely useful. Synthetics runs from 17 global locations. The unified query language (NRQL) is easier to learn than PromQL.
4. Dynatrace
Best for: Enterprise teams that want AI-driven root cause analysis across deeply complex distributed systems.
Dynatrace takes a different philosophy to Datadog: automated topology mapping and AI-powered root cause analysis (Davis AI) rather than requiring manual dashboard creation. For enterprises running hundreds of microservices, Dynatrace's automatic dependency detection reduces the time from alert to resolution.
Pricing: Minimum annual spend commitment. Full-stack monitoring from $0.08/hour/GiB host. Roughly $69–$150+/month at minimum viable scale.
Limitation: Very expensive at scale. According to CubeAPM's comparison, a small team costs ~$7,740/month — similar to Datadog.
5. SolarWinds Observability
Best for: Teams already in the SolarWinds ecosystem or looking for a modular observability platform that avoids all-or-nothing pricing.
SolarWinds Observability offers application performance monitoring, infrastructure monitoring, log management, and digital experience monitoring in separate, combinable modules. The modular pricing model means you don't pay for infrastructure monitoring if you only need APM.
Pricing: Usage-based tiers with 30-day free trial. Mix-and-match module pricing.
6. Elastic Observability
Best for: Teams already invested in Elasticsearch who want to unify APM, logs, metrics, and traces in the same Elastic stack.
Elastic Observability builds on Elasticsearch/Kibana with Elastic APM, machine learning–based anomaly detection, and OpenTelemetry support. Teams already using Elasticsearch for log aggregation can extend to APM without introducing a new vendor. The self-managed option provides full data control.
Pricing: Free (basic tier). Usage-based on Elastic Cloud. Enterprise subscriptions available.
7. Amazon CloudWatch
Best for: AWS-native teams that want observability deeply integrated with their AWS service mesh.
Amazon CloudWatch provides metrics, logs, alarms, dashboards, and synthetic monitoring for AWS workloads. For teams running entirely on AWS, CloudWatch's tight integration with Lambda, ECS, RDS, and every other AWS service reduces instrumentation overhead dramatically — the agent auto-discovers and ships telemetry without custom configuration.
Pricing: First metric is free. $0.30 per custom metric/month beyond free tier. Synthetics from $0.0012/run.
Limitation: Heavily AWS-centric. Multi-cloud teams find CloudWatch dashboards inadequate for GCP/Azure workloads. The UI is functional but harder to use than Grafana or Datadog.
8. Better Stack
Best for: Teams that want logs + uptime monitoring + incident management without full observability overhead.
Better Stack covers log management, uptime monitoring, status pages, and incident management at a price point far below Datadog. It doesn't provide APM traces, but for teams whose observability needs are primarily log search + uptime + alerting, Better Stack covers the useful 80% at a fraction of the cost.
Pricing: From $29/month (uptime + log basics). Log ingestion priced separately.
Pricing Comparison
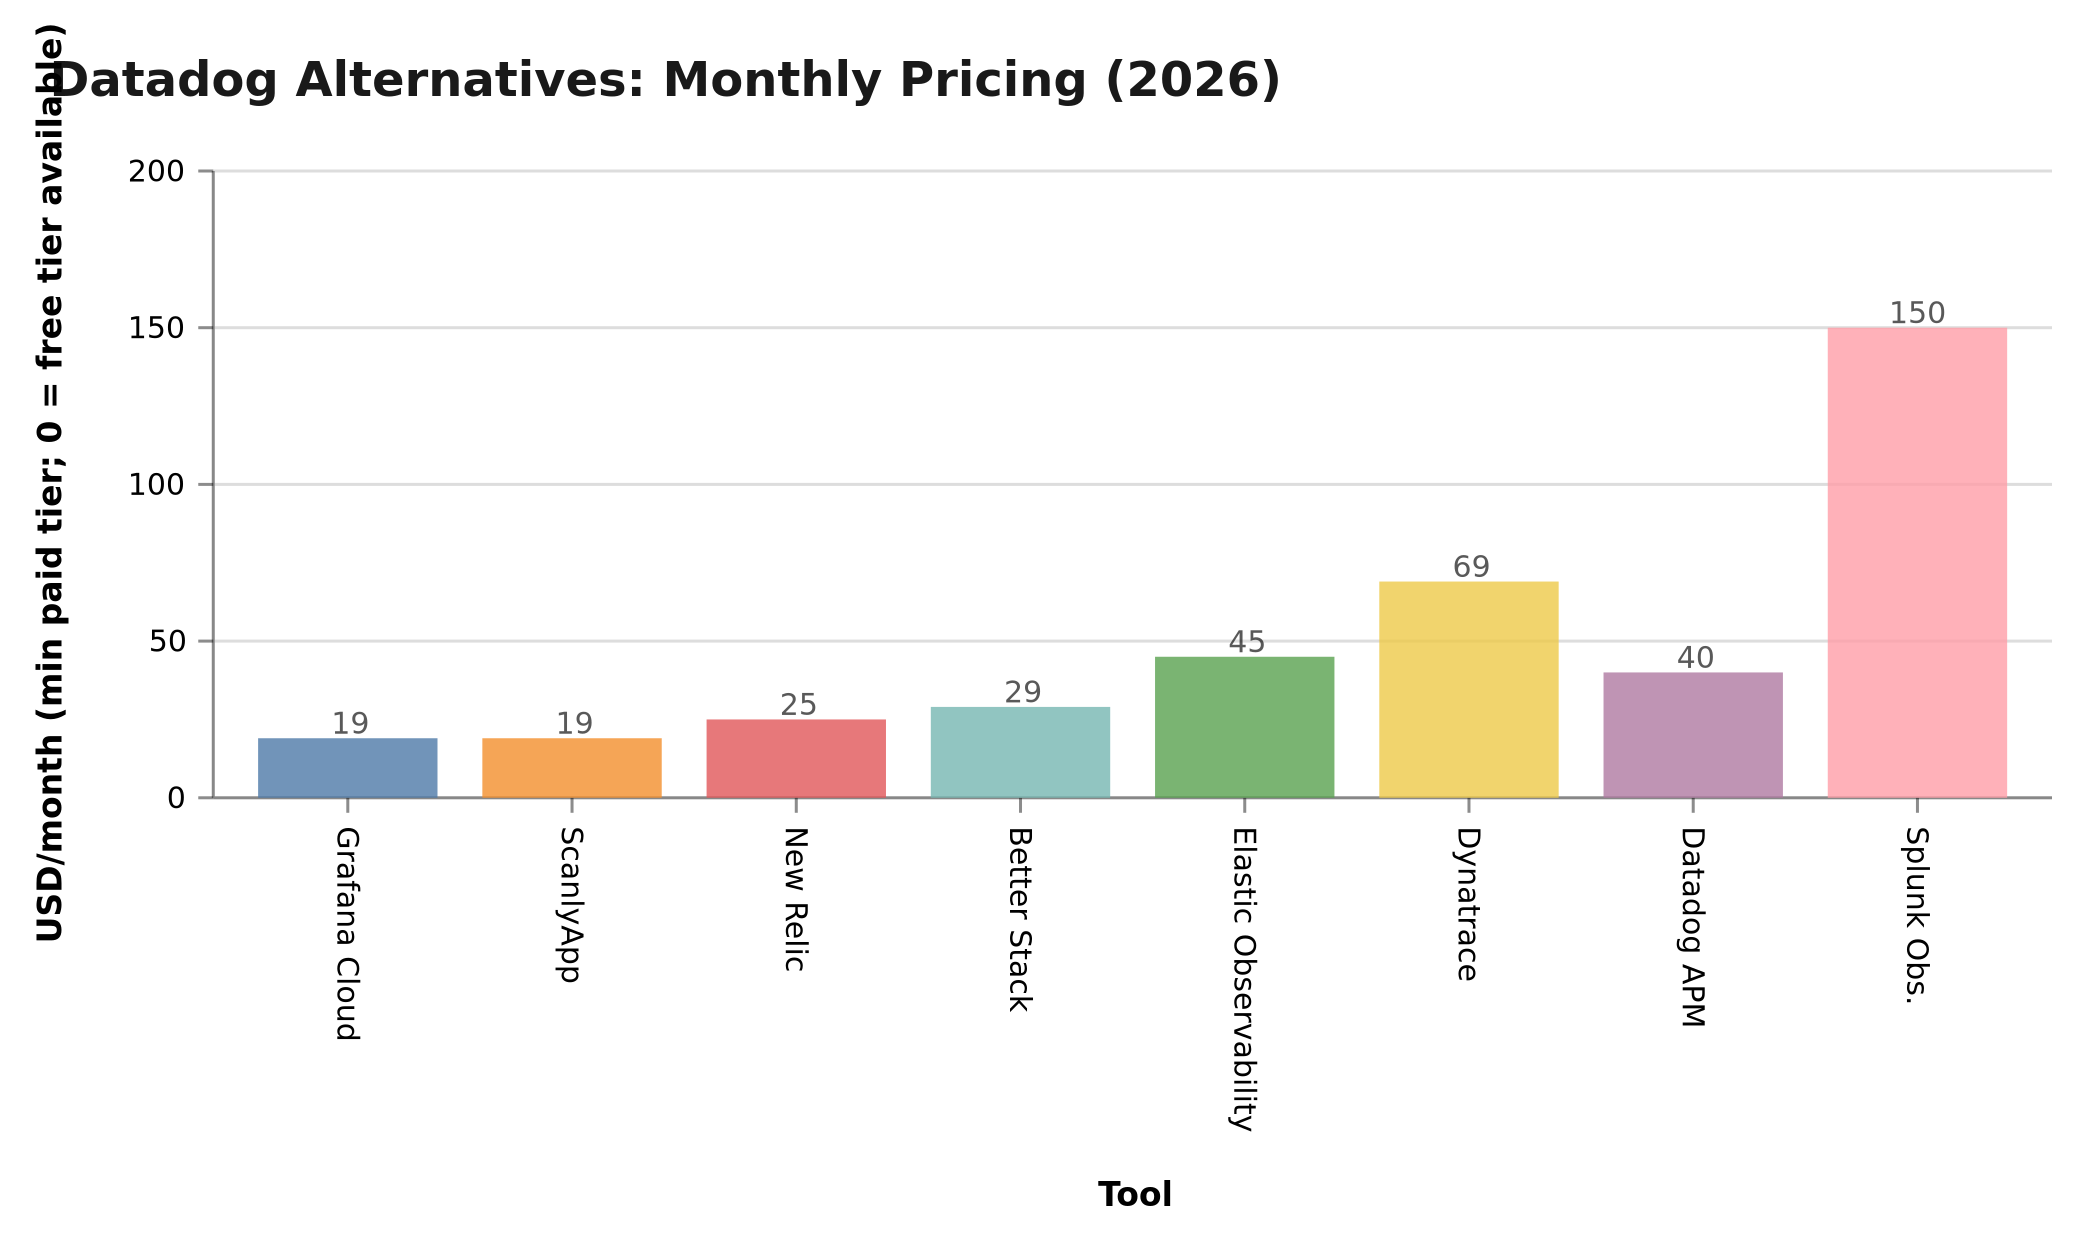 Figure: Approximate lowest monthly cost for a small team (10 engineers). Full-stack costs vary significantly with usage. Data: vendor pricing pages and independent comparisons, April 2026.
| Tool | Free Plan | Entry Cost (small team) | OpenTelemetry? | Self-hosted? |
|---|---|---|---|---|
| Datadog | ✗ (trial only) | ~$8,185/month | Partial | ✗ |
| ScanlyApp (Synthetics) | ✓ | $29/month | ✗ | ✓ |
| Grafana Cloud | ✓ | ~$3,870/month | ✓ | ✓ |
| New Relic | ✓ (100GB/mo) | $25/month+ | ✓ | ✗ |
| Dynatrace | ✗ | ~$7,740/month | Partial | Partial |
| Elastic Observability | ✓ | Variable (self-host) | ✓ | ✓ |
| CloudWatch | ✓ (AWS free) | Usage-based | ✗ | ✗ (AWS only) |
| Better Stack | ✗ | $29/month | ✗ | ✗ |
Feature Radar: Datadog vs. ScanlyApp
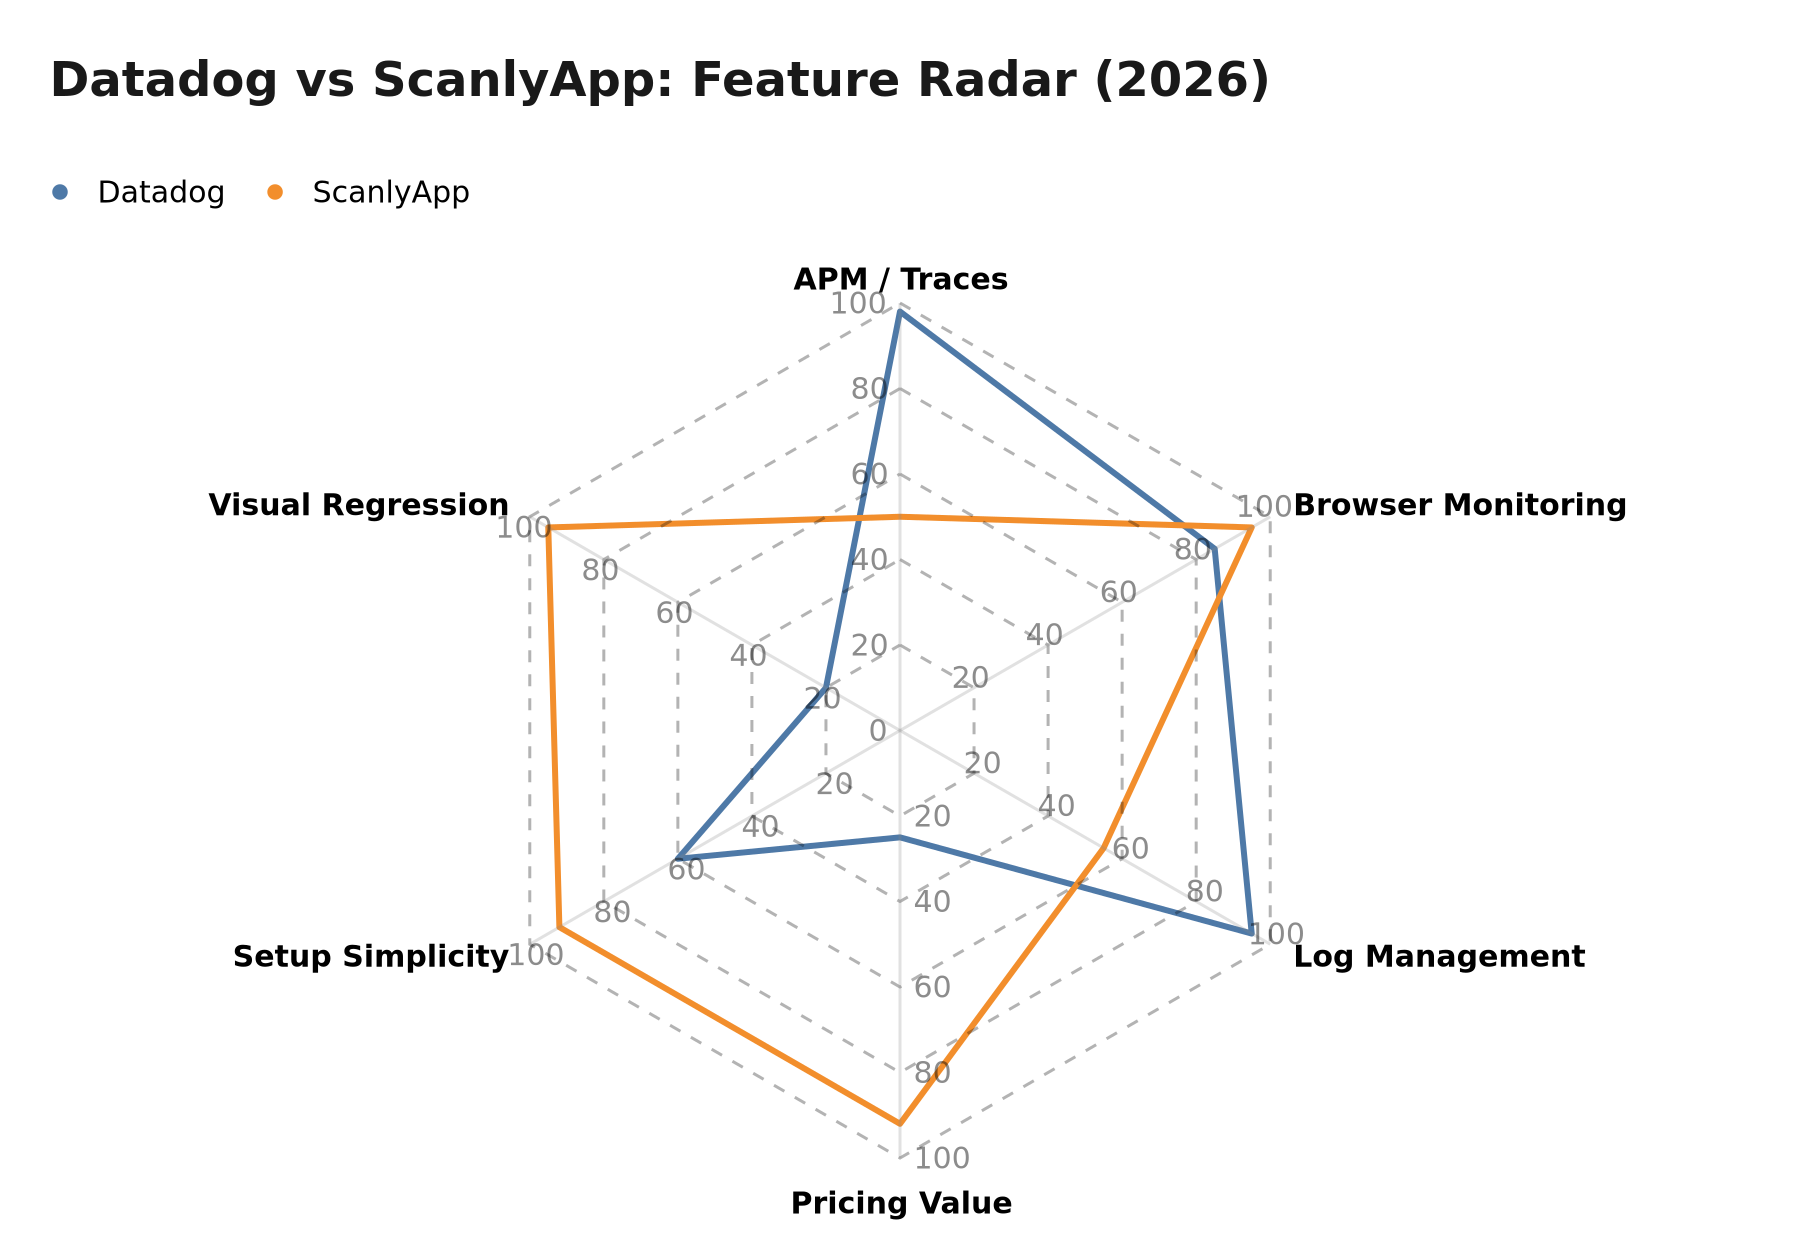 Figure: Feature scores (0–100) comparing Datadog Synthetics and ScanlyApp across APM/Traces, Browser Monitoring, Log Management, Pricing Value, Setup Simplicity, and Visual Regression. April 2026.
The Right Tool for Each Layer
The most practical Datadog alternative strategy isn't a single-tool replacement — it's a layered approach:
flowchart LR
    A[Your App] --> B[APM / Traces]
    A --> C[Logs]
    A --> D[Synthetic Browser Checks]
    A --> E[Infrastructure Metrics]
    B --> F[Datadog APM or Grafana Tempo]
    C --> G[Datadog Logs or Better Stack or Loki]
    D --> H[ScanlyApp - Playwright native, $29/mo]
    E --> I[Datadog Infra or Grafana + Prometheus]
Datadog's strength is the correlation layer — when a synthetic check fails, you can trace it directly to the APM span and related log entries in a single interface. If that correlation is critical to your on-call workflow, the cost may be justified. If your synthetic monitoring lives in a silo anyway (separate dashboard, separate alerts), ScanlyApp covers that silo at a fraction of the price.
Choosing the Right Datadog Alternative
flowchart TD
    A[Looking for Datadog alternative] --> B{What's your primary need?}
    B -- Full APM + logs + metrics --> C{Budget?}
    B -- Synthetic / browser monitoring only --> D[ScanlyApp]
    B -- Logs + uptime + incidents only --> E[Better Stack]
    C -- Minimize cost, own infra --> F[Grafana + Prometheus self-hosted]
    C -- Managed + transparent pricing --> G[New Relic or Grafana Cloud]
    C -- Enterprise AI root cause analysis --> H[Dynatrace]
    D --> I{Also need visual regression?}
    I -- Yes --> D
    I -- APM is the priority --> J[Combine ScanlyApp + Grafana Tempo]
Further Reading
- OpenTelemetry getting started guide
- Grafana Loki log aggregation documentation
- SigNoz New Relic alternatives analysis
Related articles:
